Data Visualizations
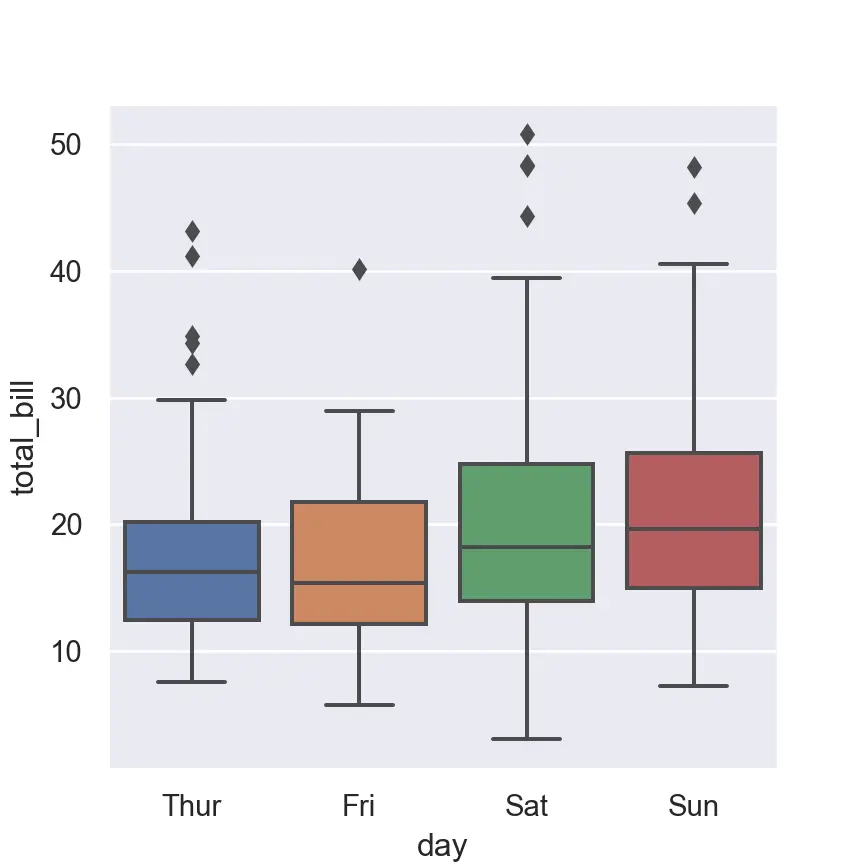
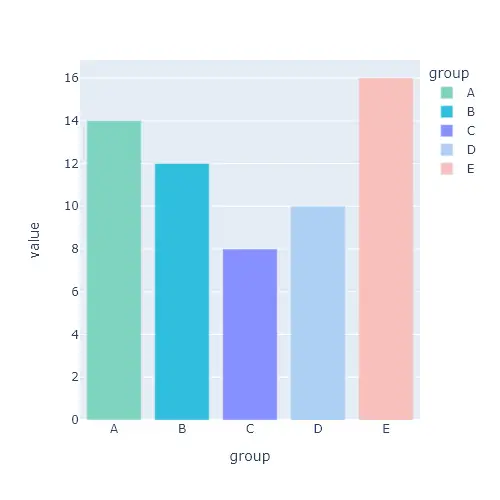
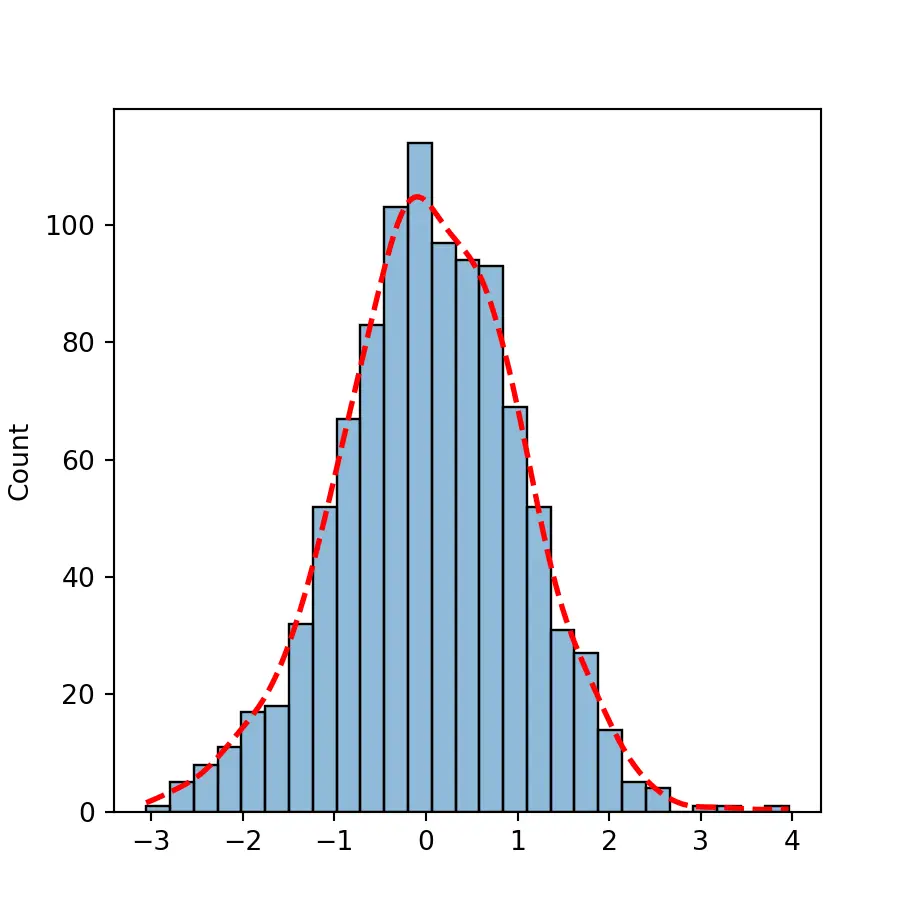
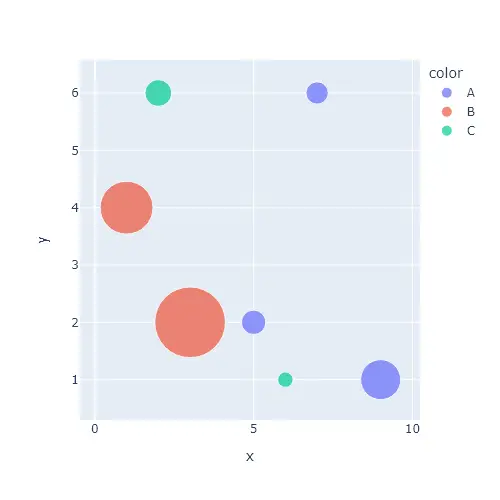
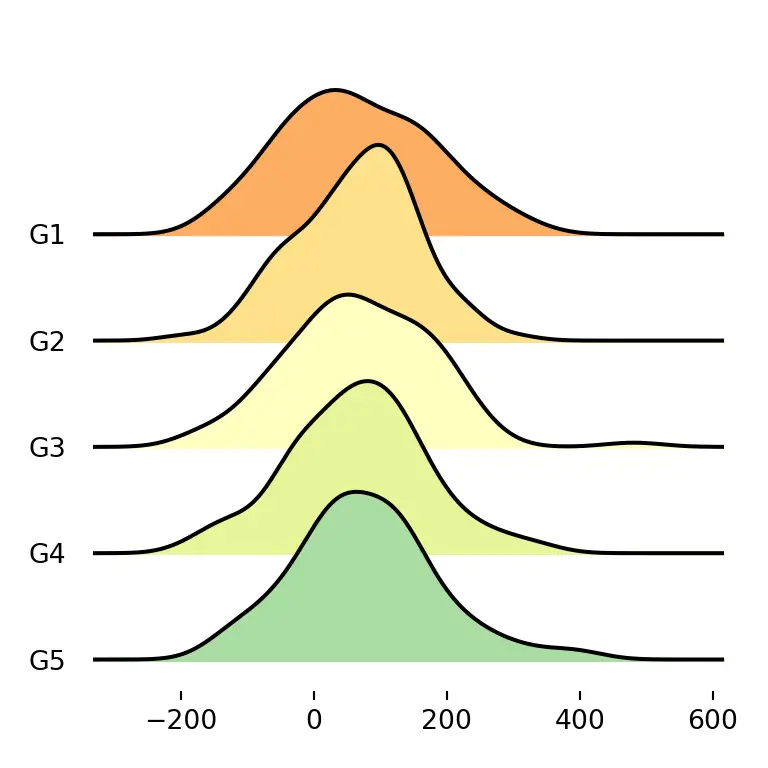
Data visualization graphics are created using Python libraries such as Matplotlib, Seaborn, and Plotly. Possessing a versatile skill set, such as mine, enables the selection of the right tool for specific tasks, offering a comprehensive range of abilities to generate attractive static, animated, interactive, and informative statistical graphics.