
Data Project Timeline
The Data Project Timeline provides a structured framework for planning and executing data initiatives. By organizing tasks, setting key milestones, and establishing clear deadlines. Additionally, it proactively identifies risks—addressing potential bottlenecks and delays early—to ensure consistent, on-target delivery.
Business Analysis
Systematic examination of obstacles and issues faced by a company to identify solutions and opportunities for business growth.
Data Discovery
Unlocking hidden insights drives data-driven decisions, fueling innovation and competitiveness in a data-centric world.
Data Validation
Reliable insights are core to making cost-effective decisions, ensuring financial prudence, and trust in data-driven strategies.
Data Communication
Effective communication promotes smooth business intelligence exchange, enhancing intellectual endeavor for optimized outcomes.
Data Cleaning: Columns & Rows
Addressing the accuracy and consistency of column and row values plays a vital role in data analysis. This precision leads to high-quality data, enabling the generation of impactful insights that are critical for making informed, strategic decisions in addressing complex business problems.
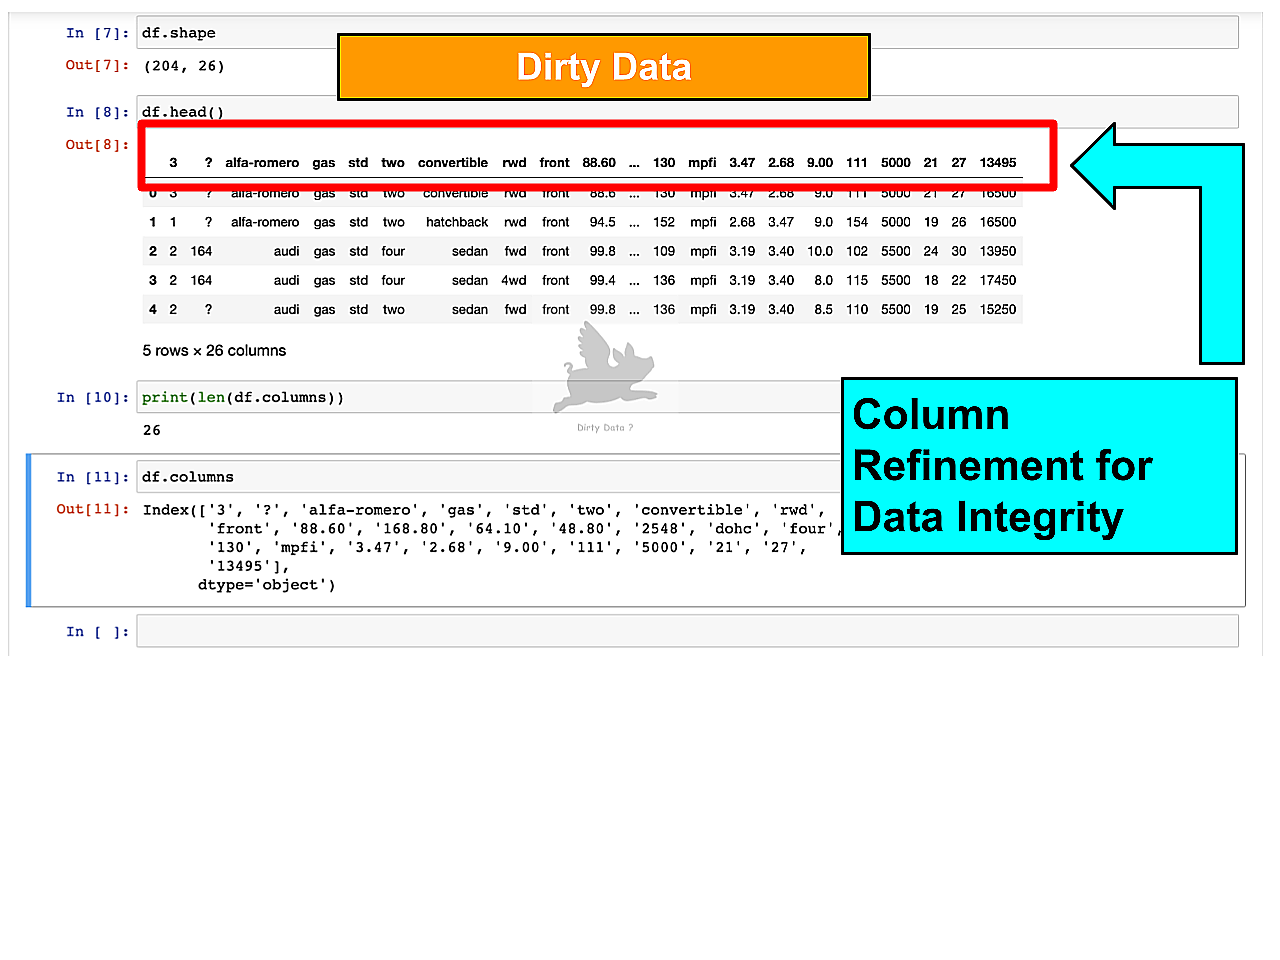
Data Cleaning: Columns
The image illustrates an unstructured dataset with missing column variables, instead displaying row values as pseudo columns.
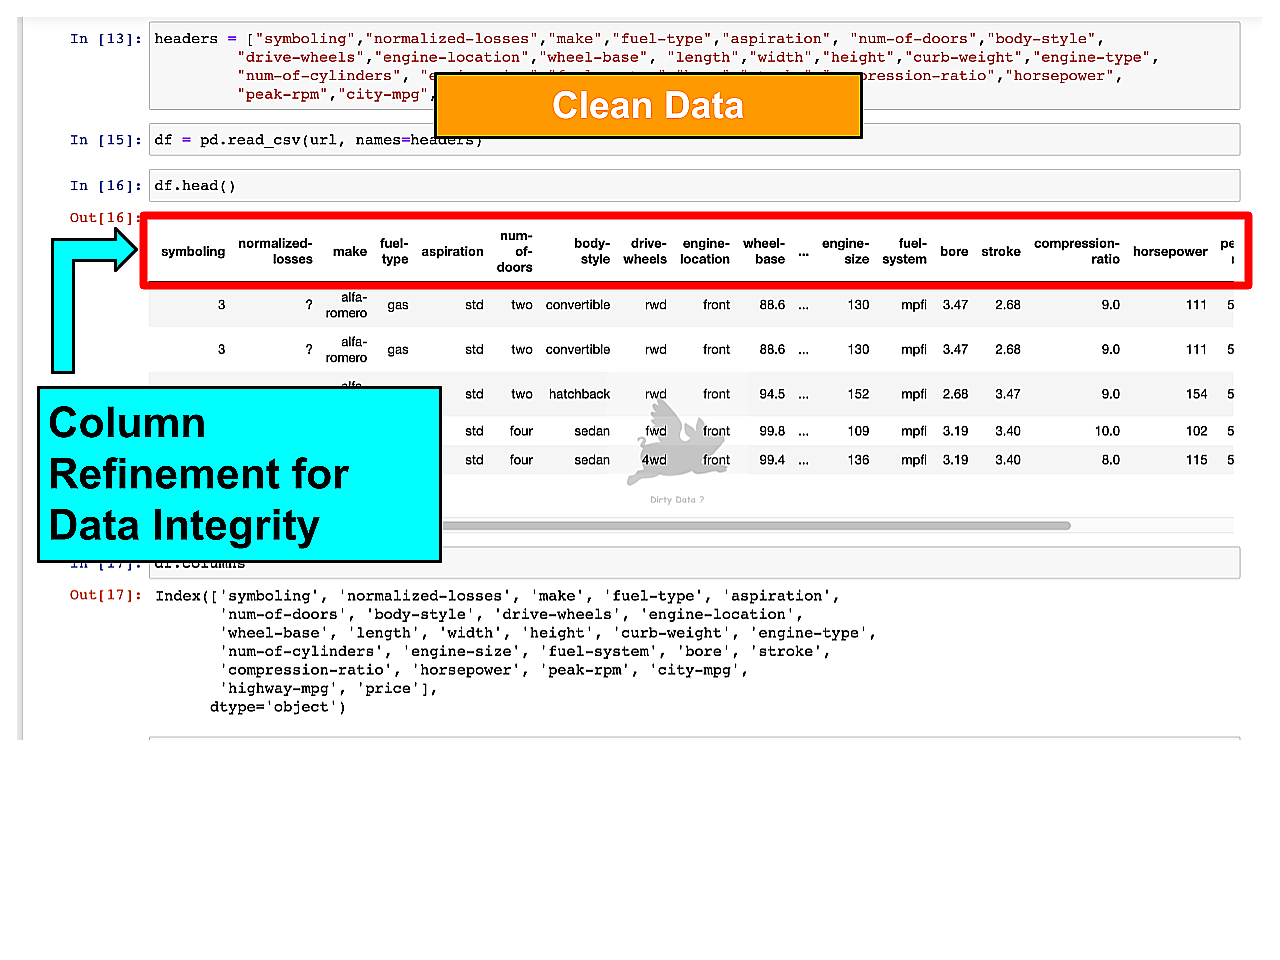
Data Cleaning: Columns
Application of data cleaning techniques transformed data into an accurate and structured dataset with properly defined column variables.
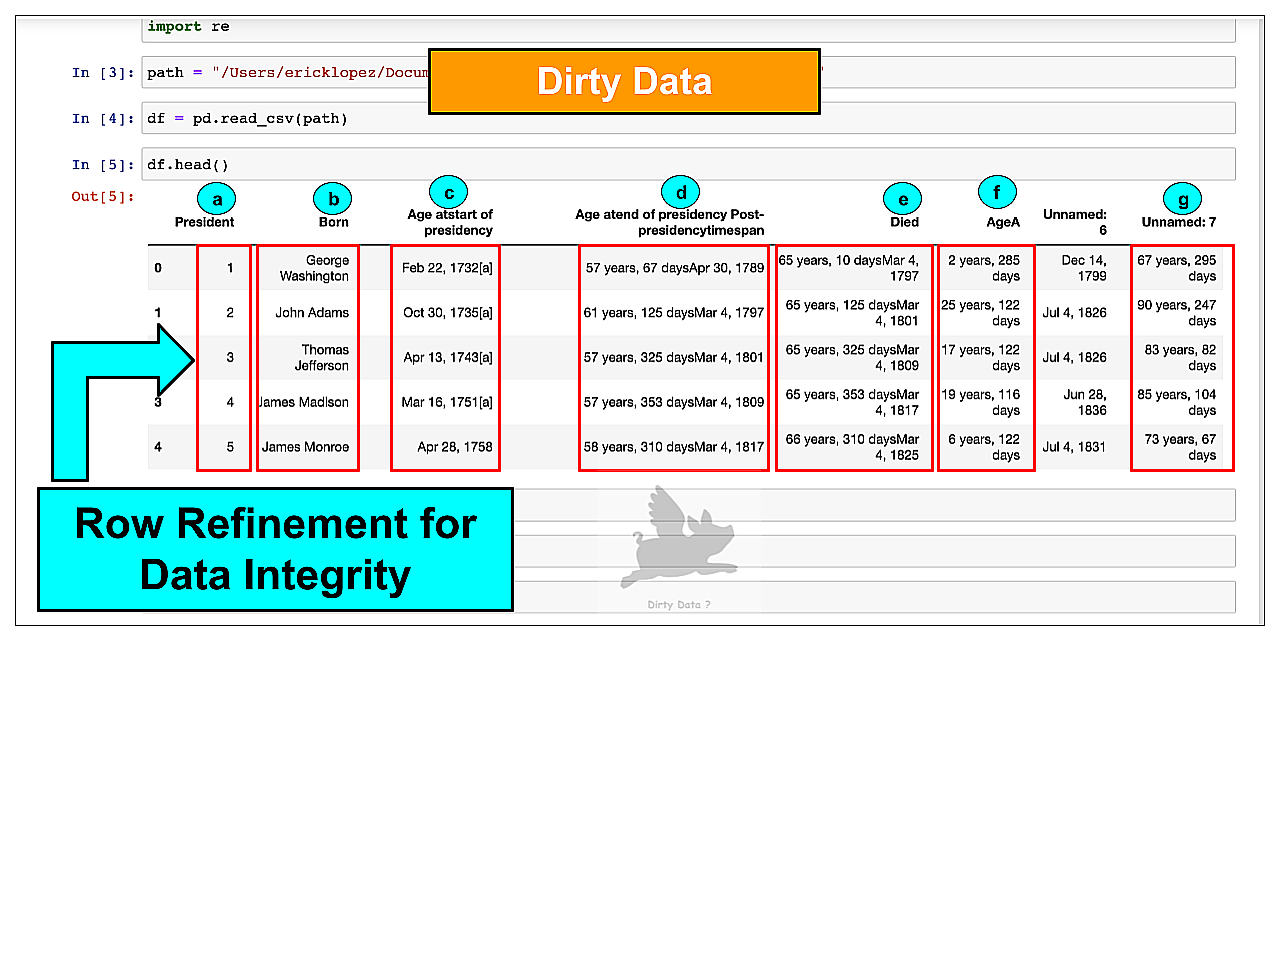
Data Cleaning: Rows
Image captures the initial state of a dataset featuring unstructured dates, mixed data types, intricate integer formats, unnecessary data elements.
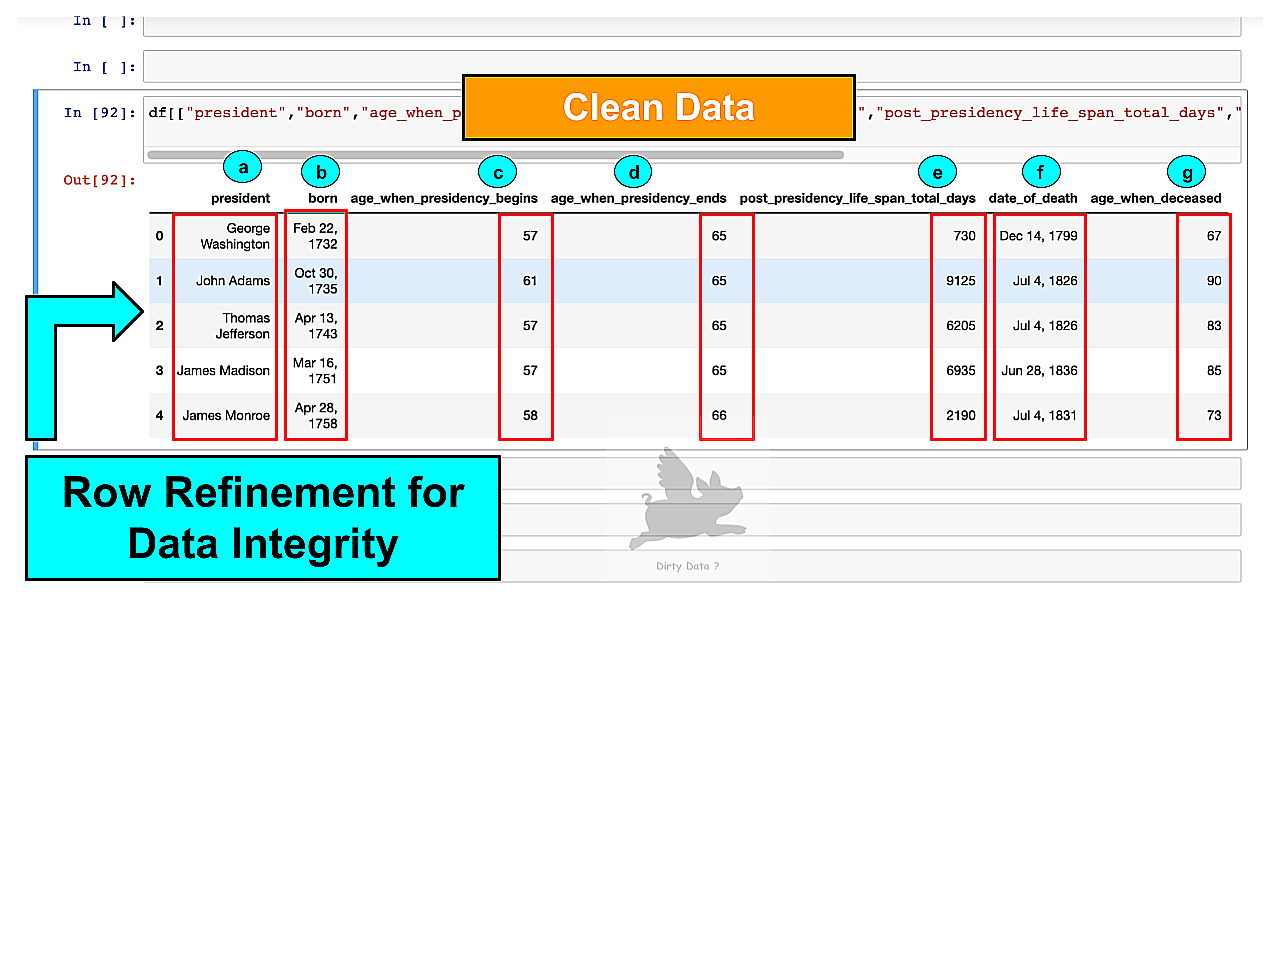
Data Cleaning: Rows
Data cleaning techniques highlight structured dates, uniform data types, consistent integer format, and the removal of redundant and unnecessary data.
Handling Duplicate Values
Attentive handling of duplicate values prevents distorted insights, misleading calculations, and inaccurate business decisions. My expertise in systematically addressing duplicate values ensures the achievement of business objectives and the maintenance of a competitive edge.
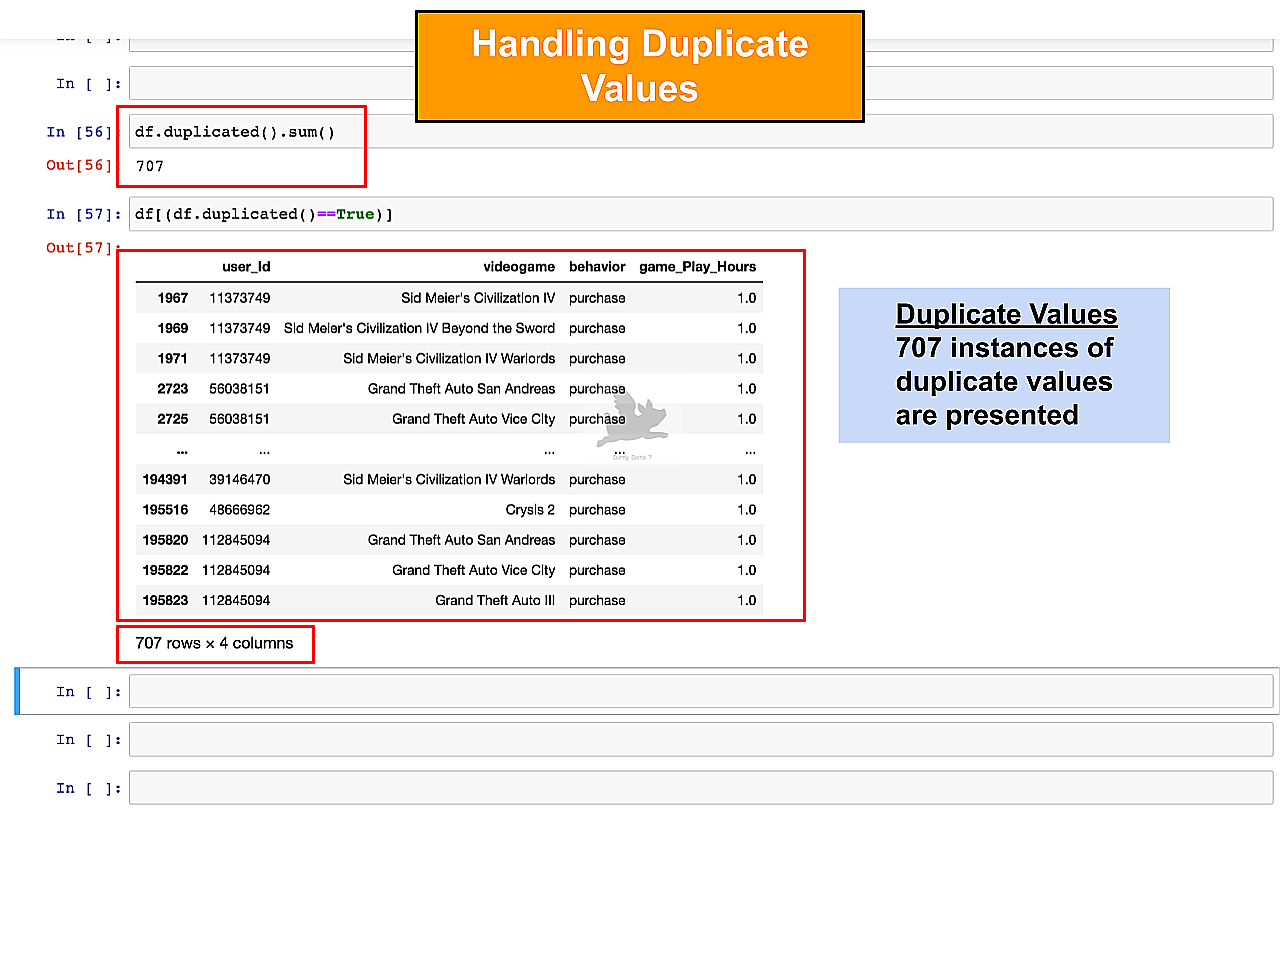
Handling Duplicate Values
The image portrays a dataset with 707 duplicate row values. Data deduplication will be applied to ensure analytical precision.
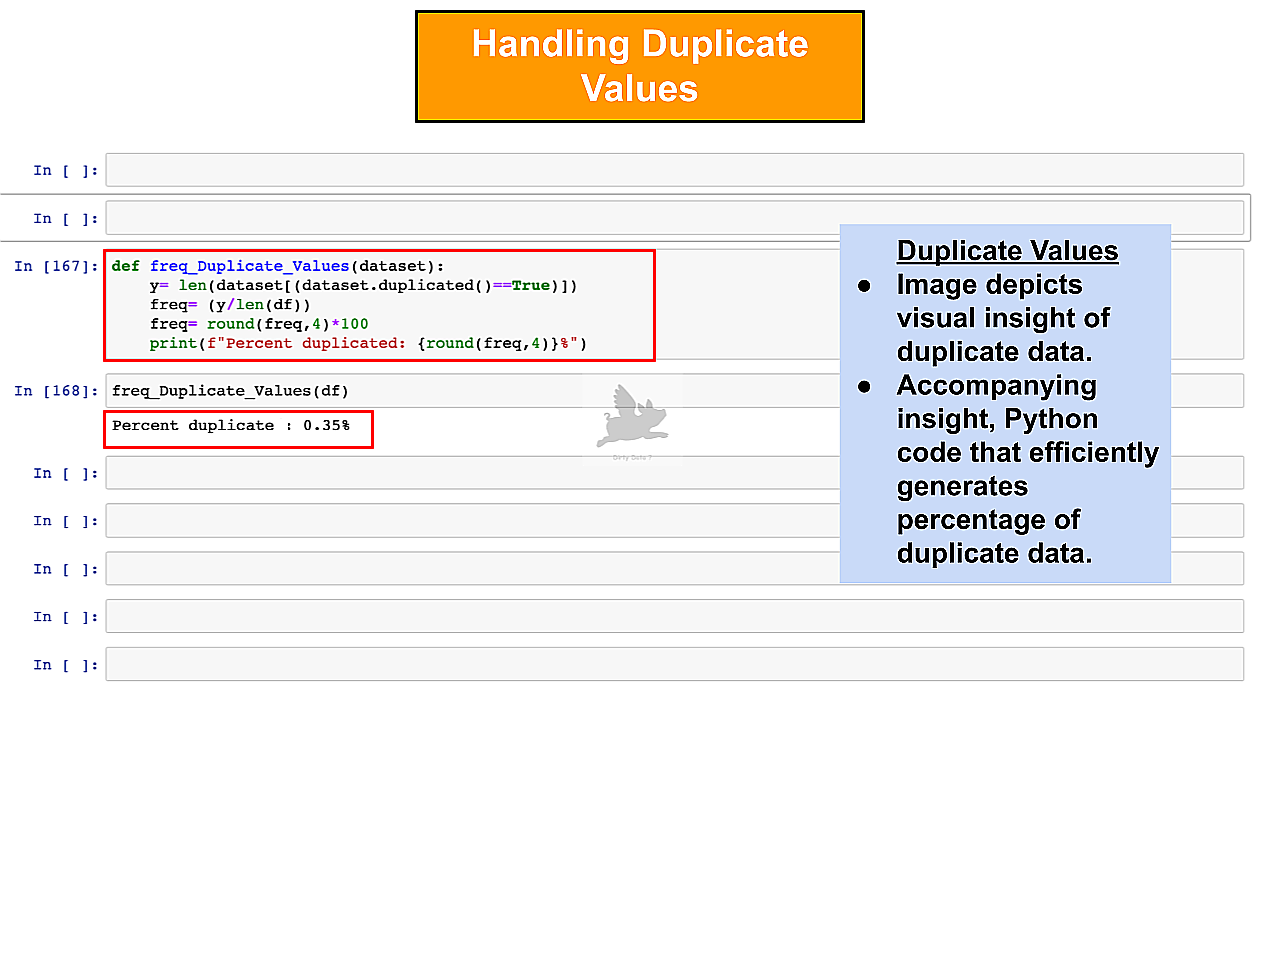
Python Code Automation
Image showcases the Python code for automating the analysis of relative frequency in duplicate values.
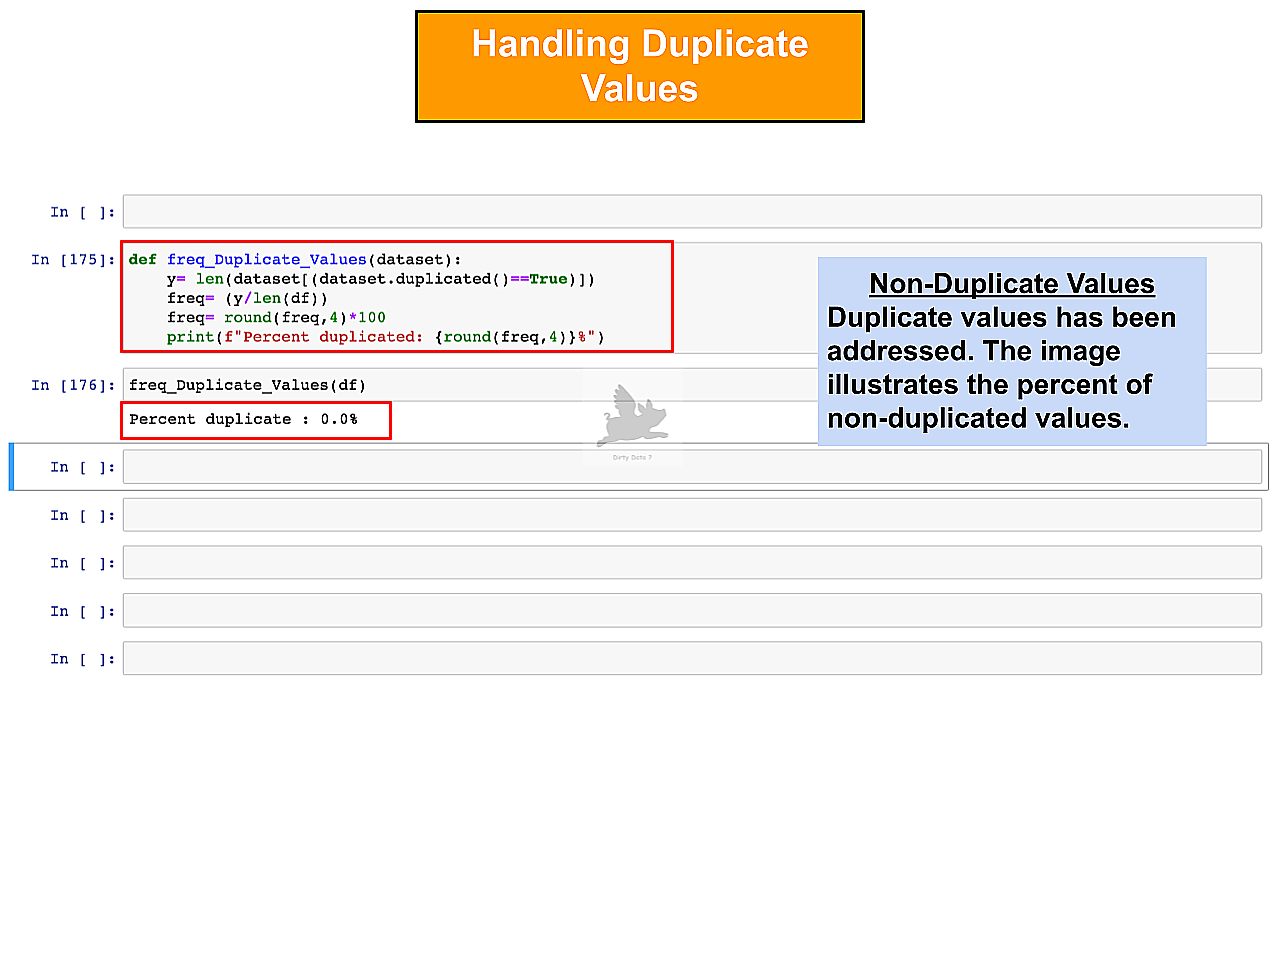
Deduplicated Results
Image displays deduplicated results, demonstrating effective handling for gold standard data quality.
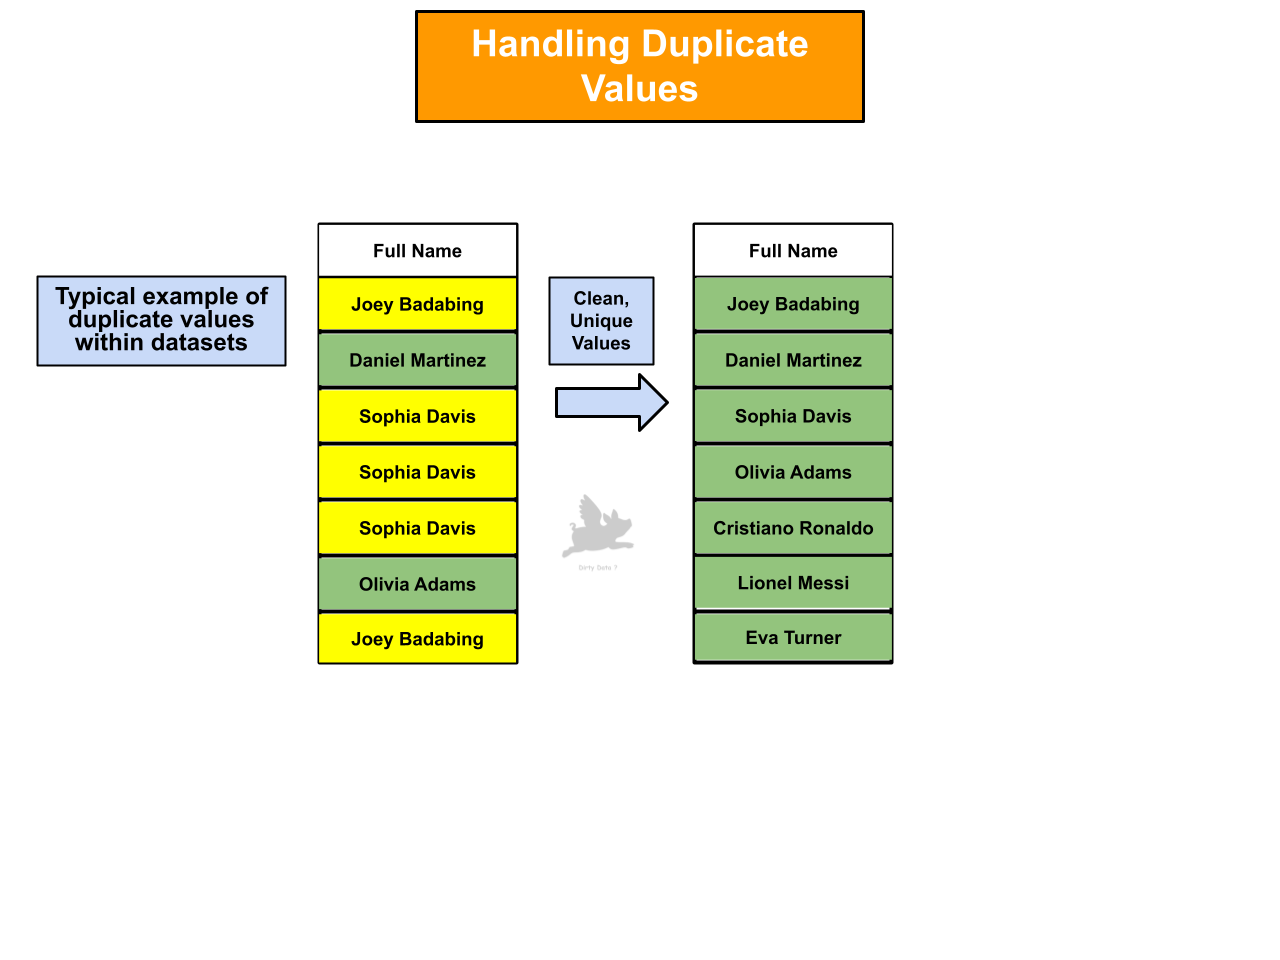
Duplicate Values Figure
Figure displays the common appearance of duplicate values, providing insight on how data quality is examined.
Handling Null Values
To effectively handle null values—data gaps, missing or unknown data points—a customized approach is essential and should be tailored to the specific dataset. It is imperative to possess comprehensive expertise when selecting the most fitting null handling techniques. This includes a deep understanding of how each technique is applied, its impact on the dataset, and a keen awareness of domain-specific intricacies.
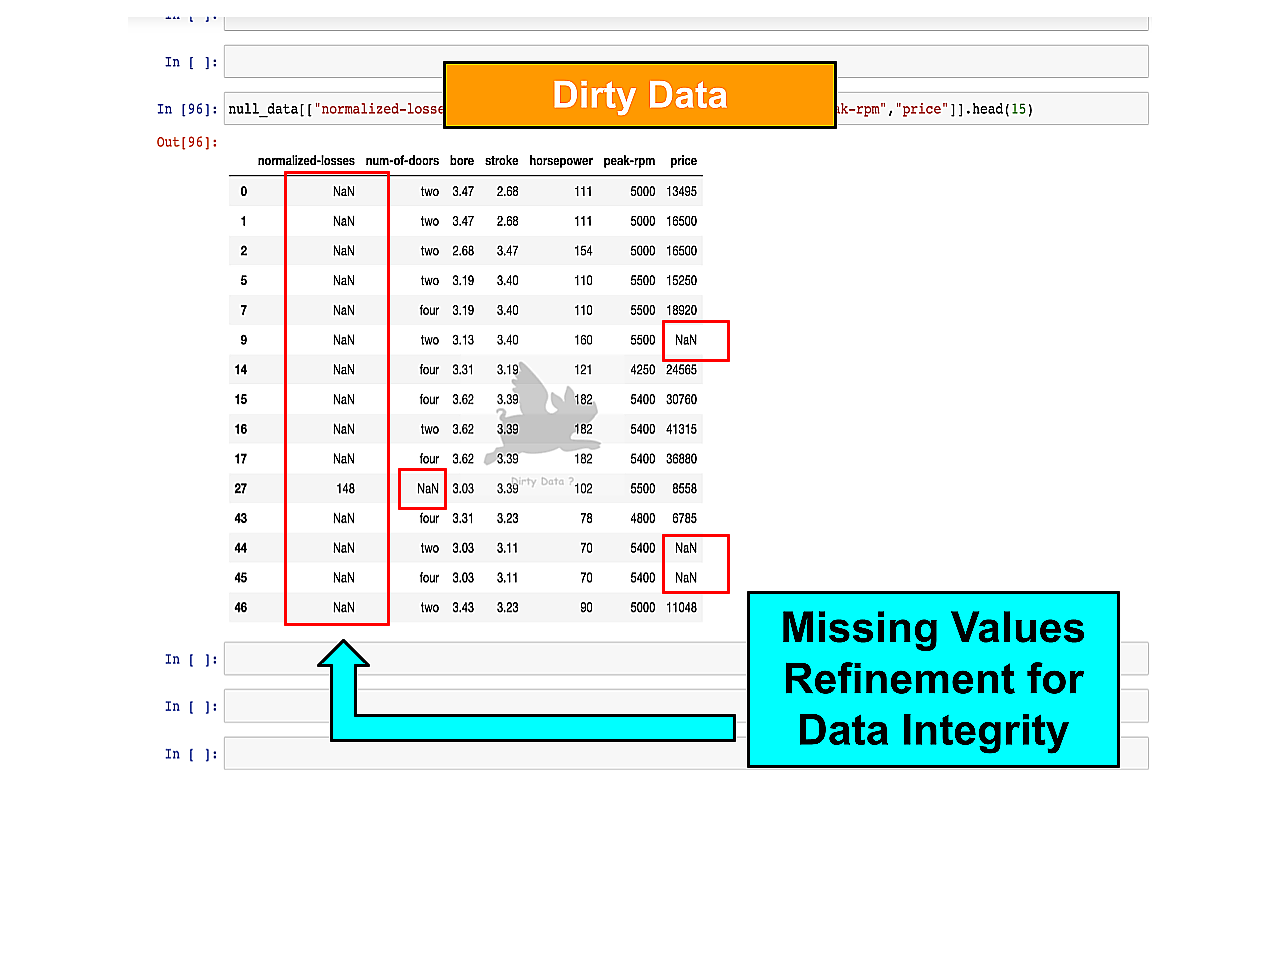
Illustrating Data Gaps
The significance of null values introduces potential bias, reduces statistical power, and impedes data accuracy and reliability.
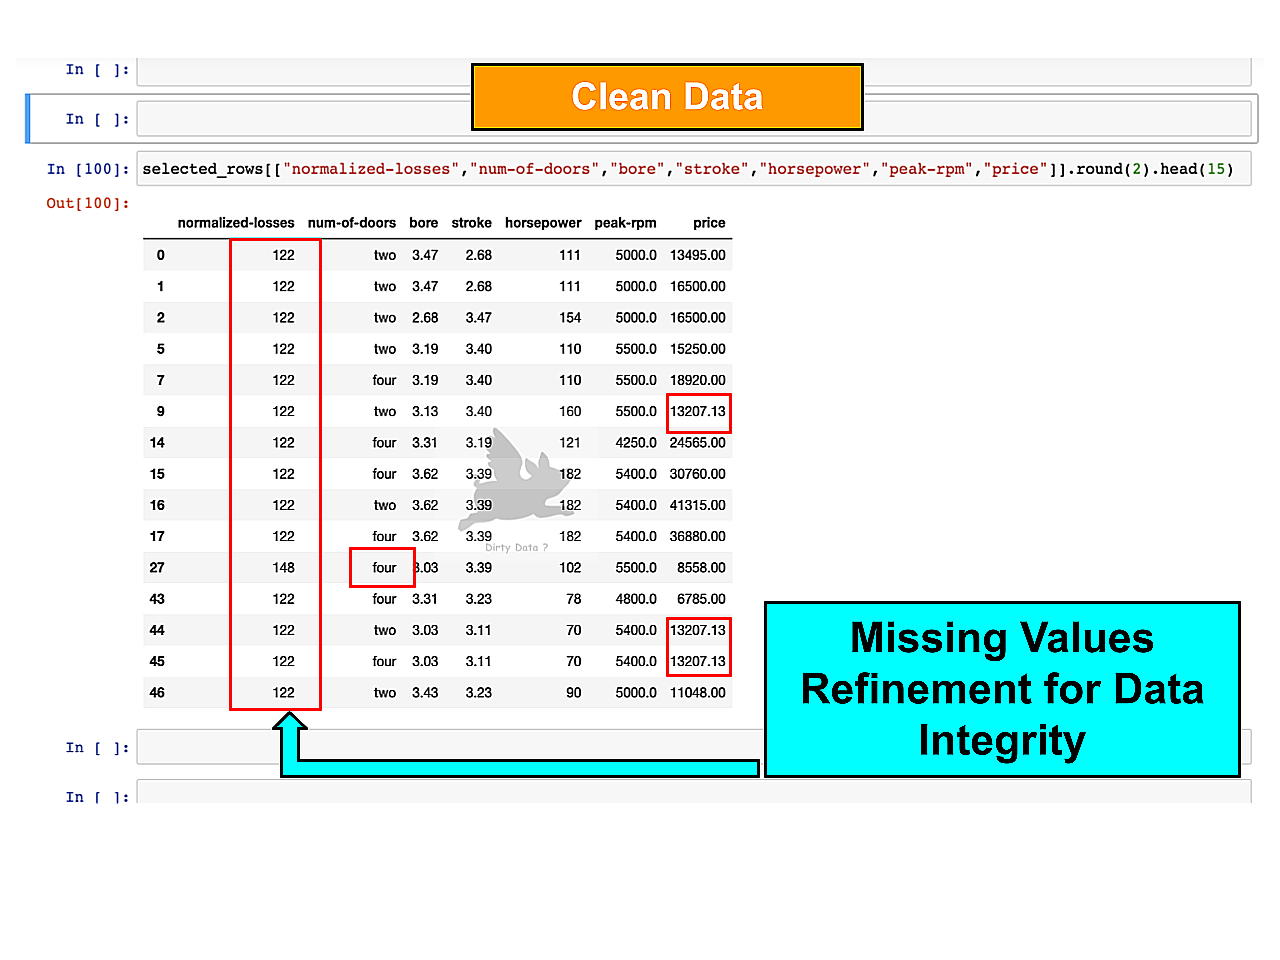
Data Gaps Refinement
Image displays correction of missing values, resulting in a more robust dataset critical for informed business intelligence.
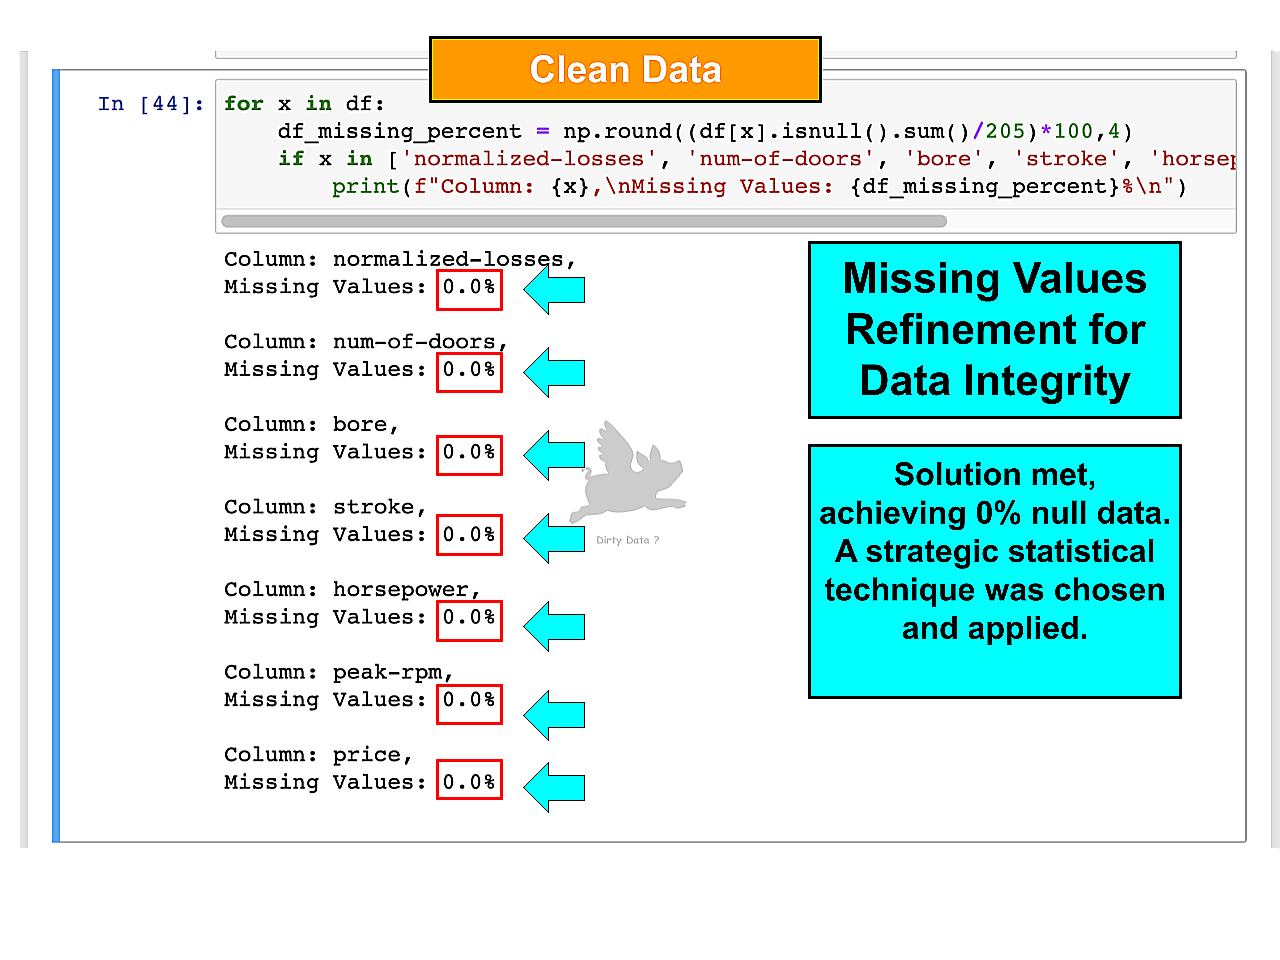
Python Code Automation
The image showcases the Python code for automating the data analysis of relative frequency in null values.
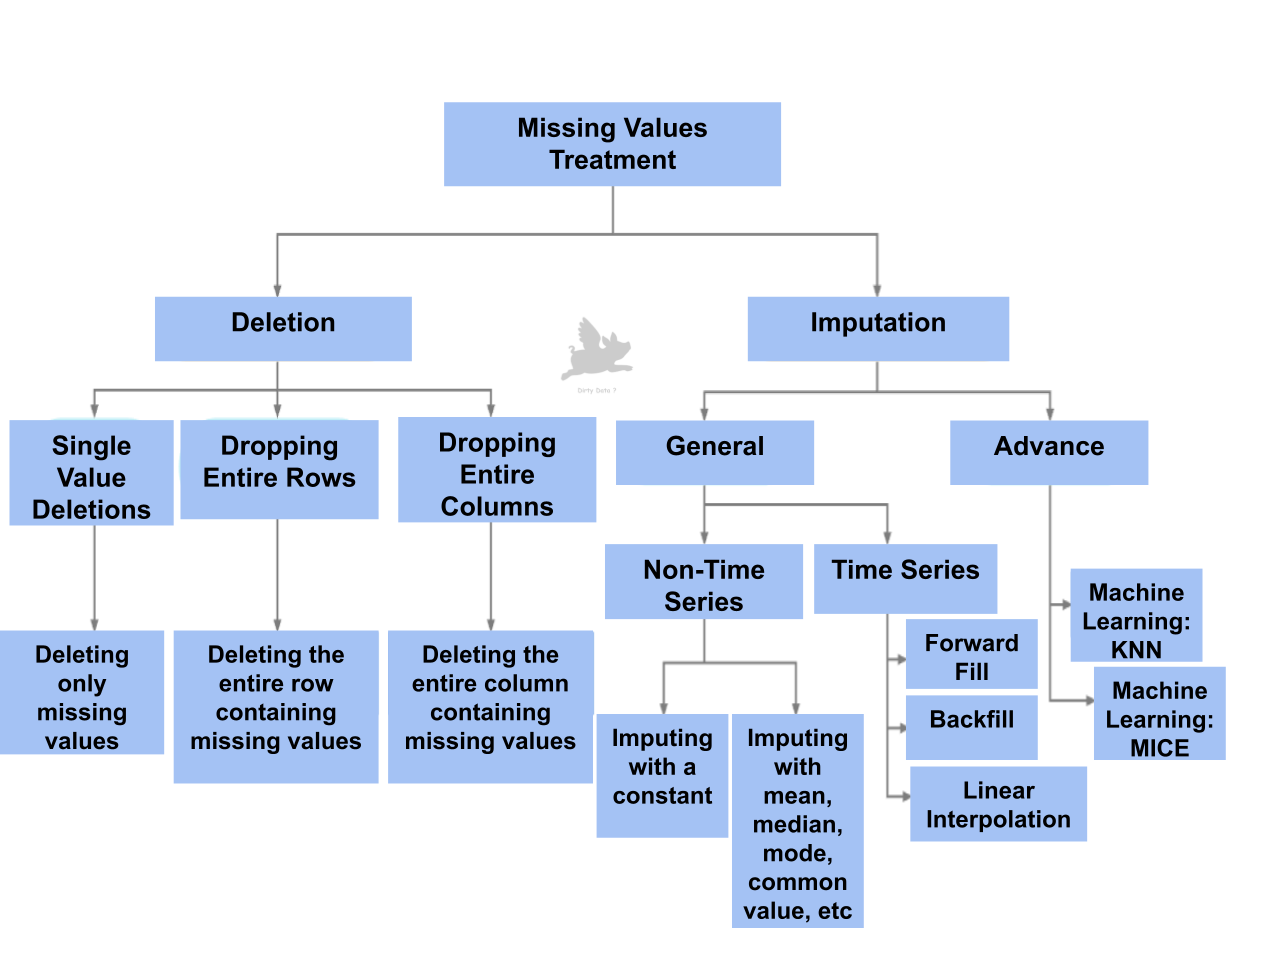
Missing Values Techniques
The image displays a comprehensive flow chart outlining various techniques for handling missing values.
Handling Outliers
Outliers, which are data points that deviate significantly from the majority, can emerge due to human errors or natural anomalies. If left unaddressed, they introduce inconsistencies and inaccuracies, leading to distorted insights. Multiple methods for detection exist, each tailored to the specific characteristics of data, thereby optimizing the business intelligence of analytical insights.
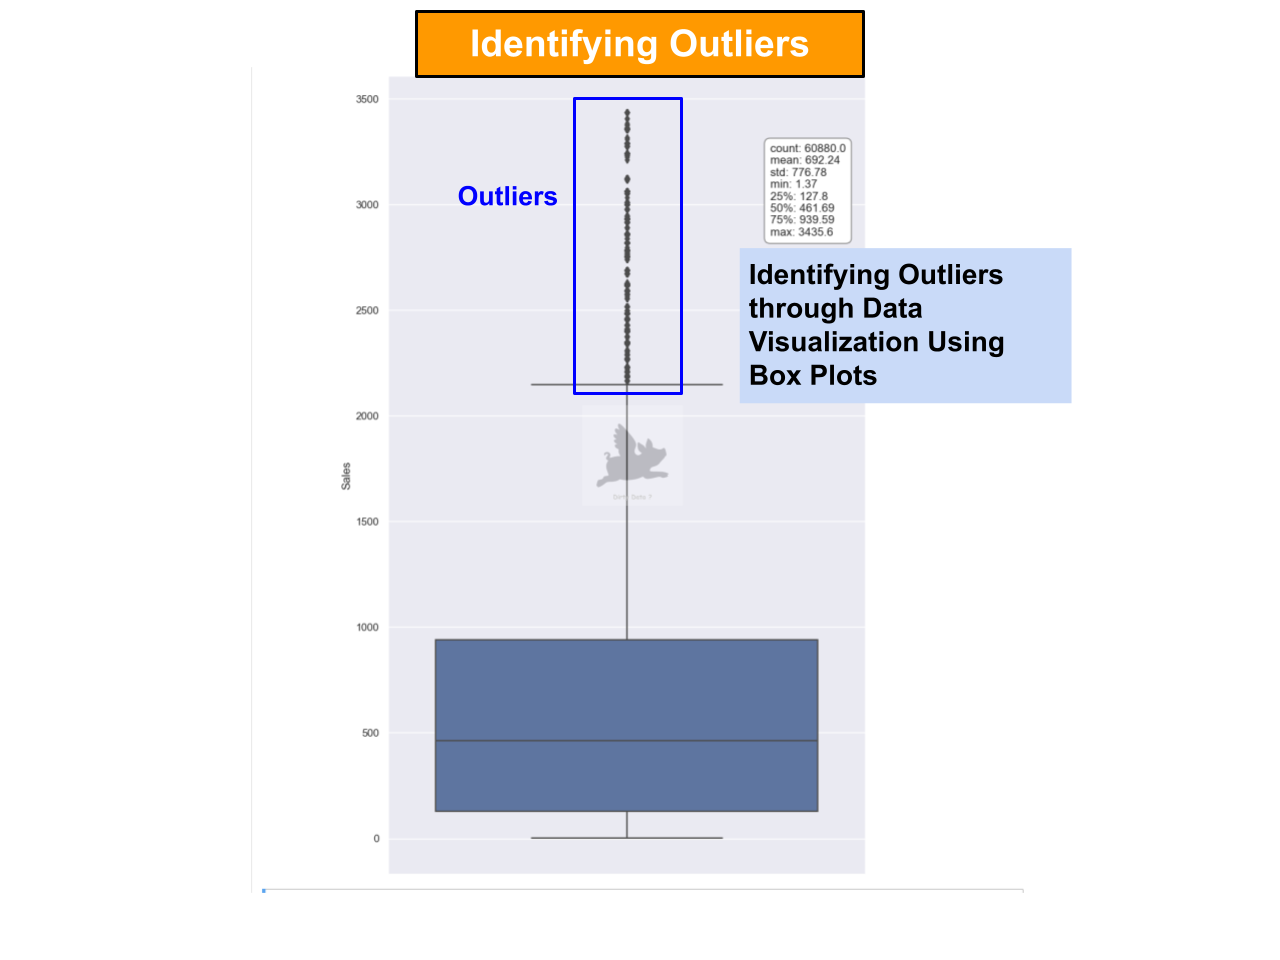
Identifying Outliers
The box plot identifies outliers for scrutiny and consideration for the application of diverse techniques in their management.
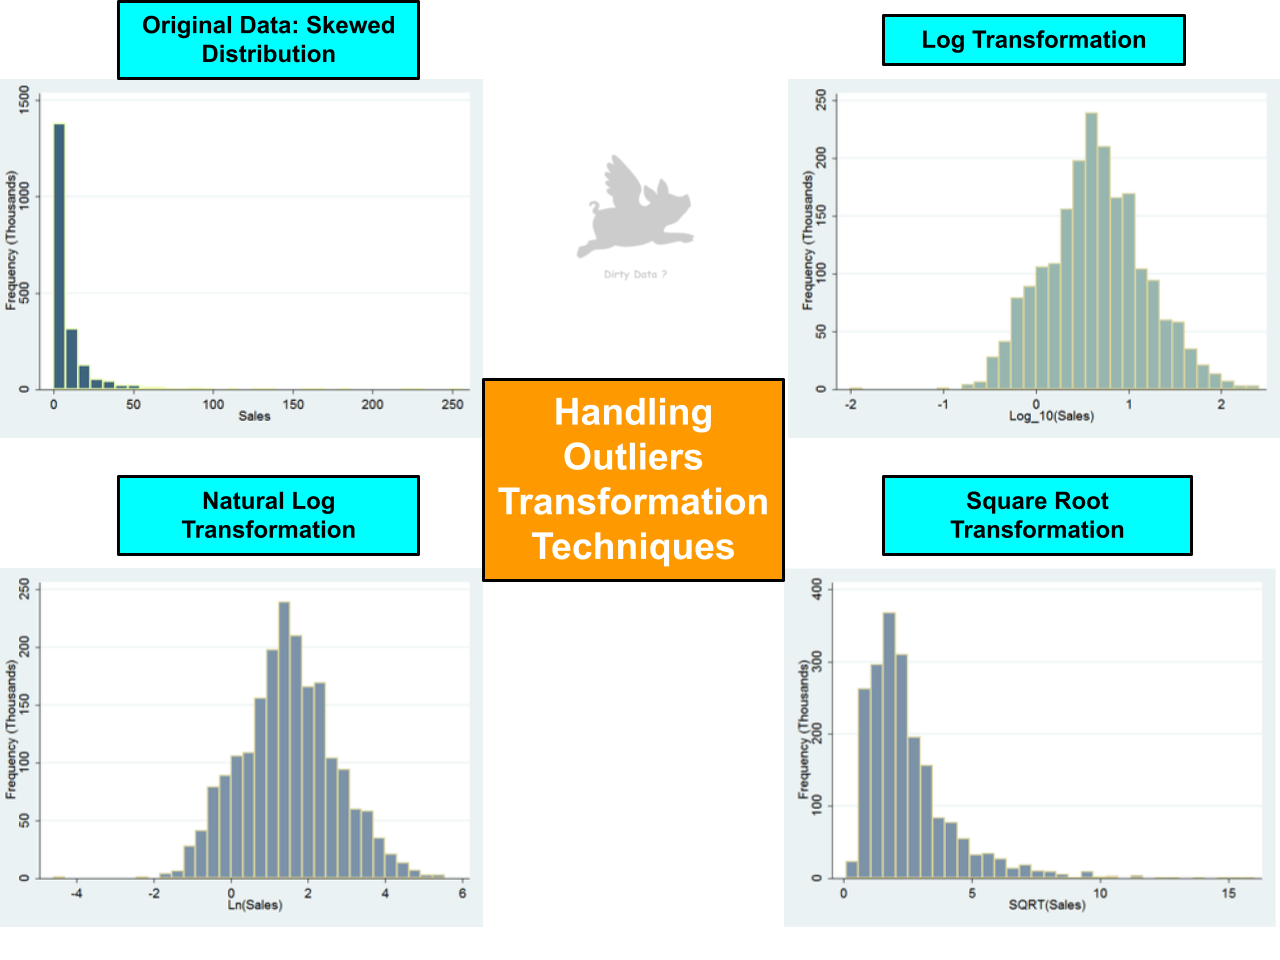
Transformation Techniques
Selecting an appropriate outlier transformation technique requires a robust comprehension of data characteristics.
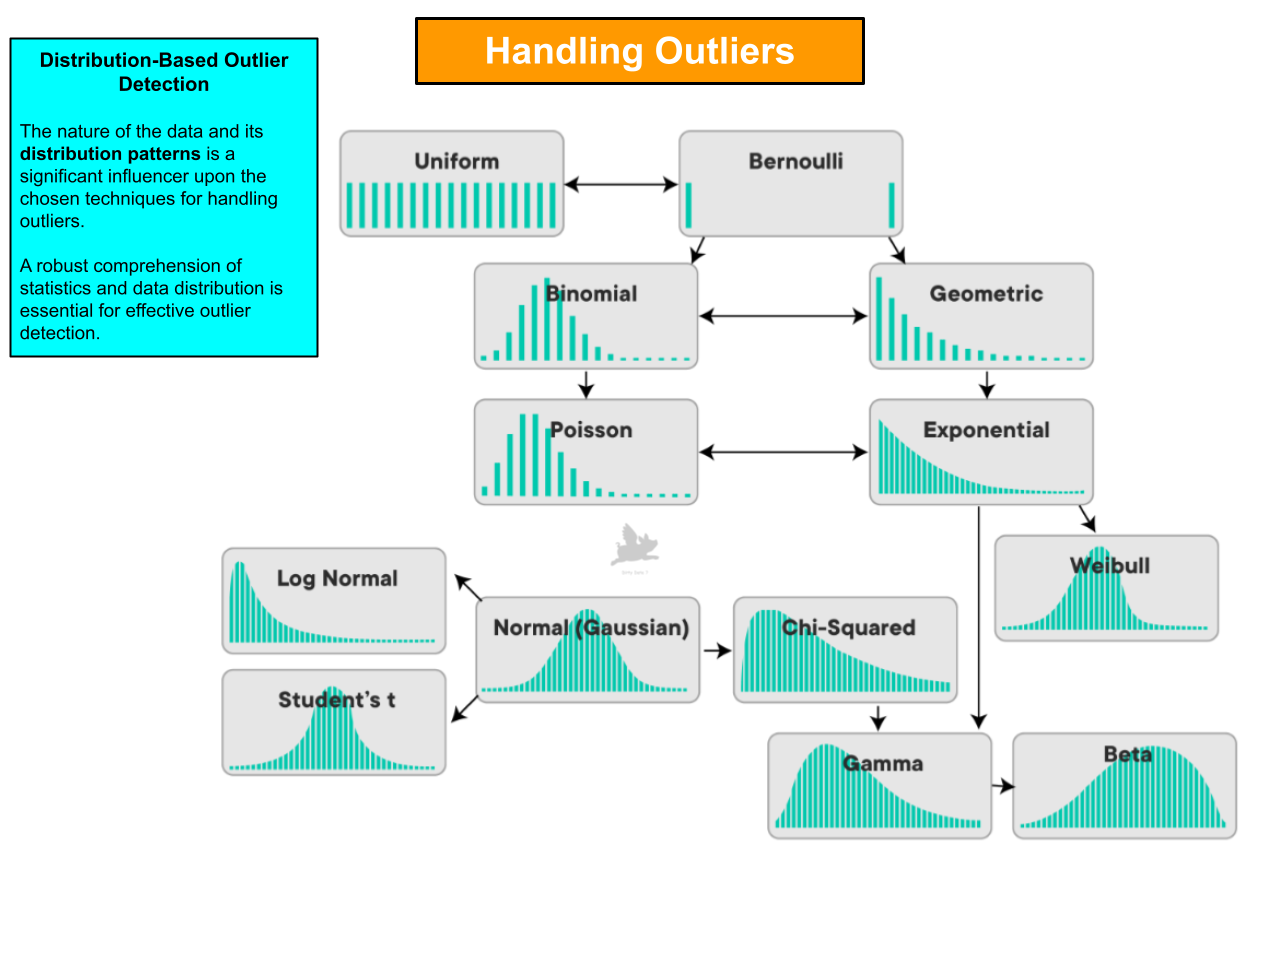
Exploring Data Dispersion
Strong statistical skills are vital for analyzing distinct distribution patterns of diverse data natures for trustworthy analysis.
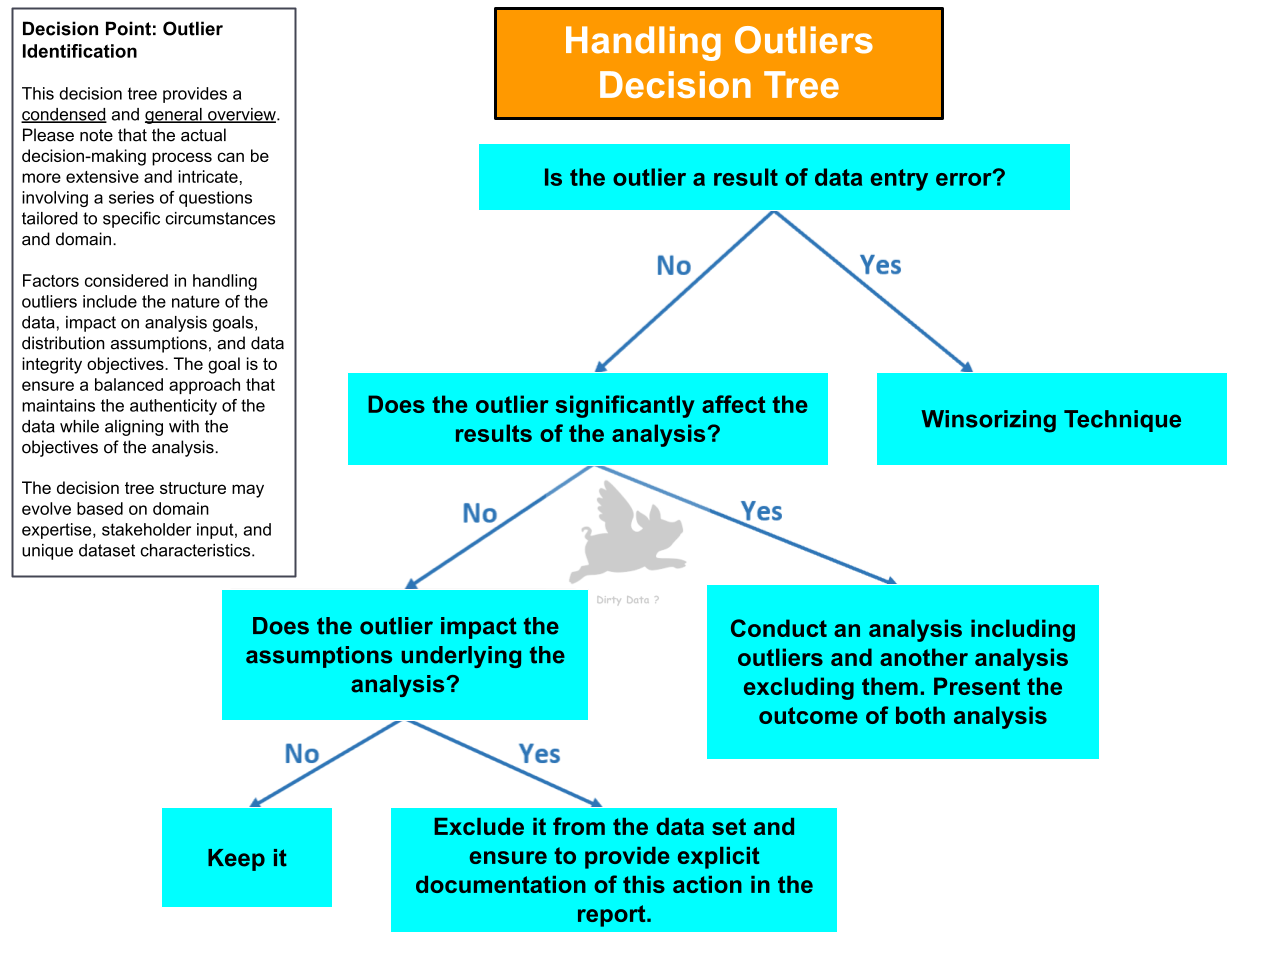
Decision Tree: Outliers
Decision trees enable the systematic handling of outliers for strategic decision-making and problem-solving.
Data Restructuring: Pivot Tables & Unpivot
Modern businesses collect vast volumes of data containing hidden commercial intelligence. Data restructuring transforms raw data into organized, coherent formats. This structured data becomes the bedrock for discovering emerging trends, anticipating market shifts, and unlocking new opportunities for successful business growth. Such a proactive approach aids in staying ahead of competitors and making strategic decisions that align with long-term goals.
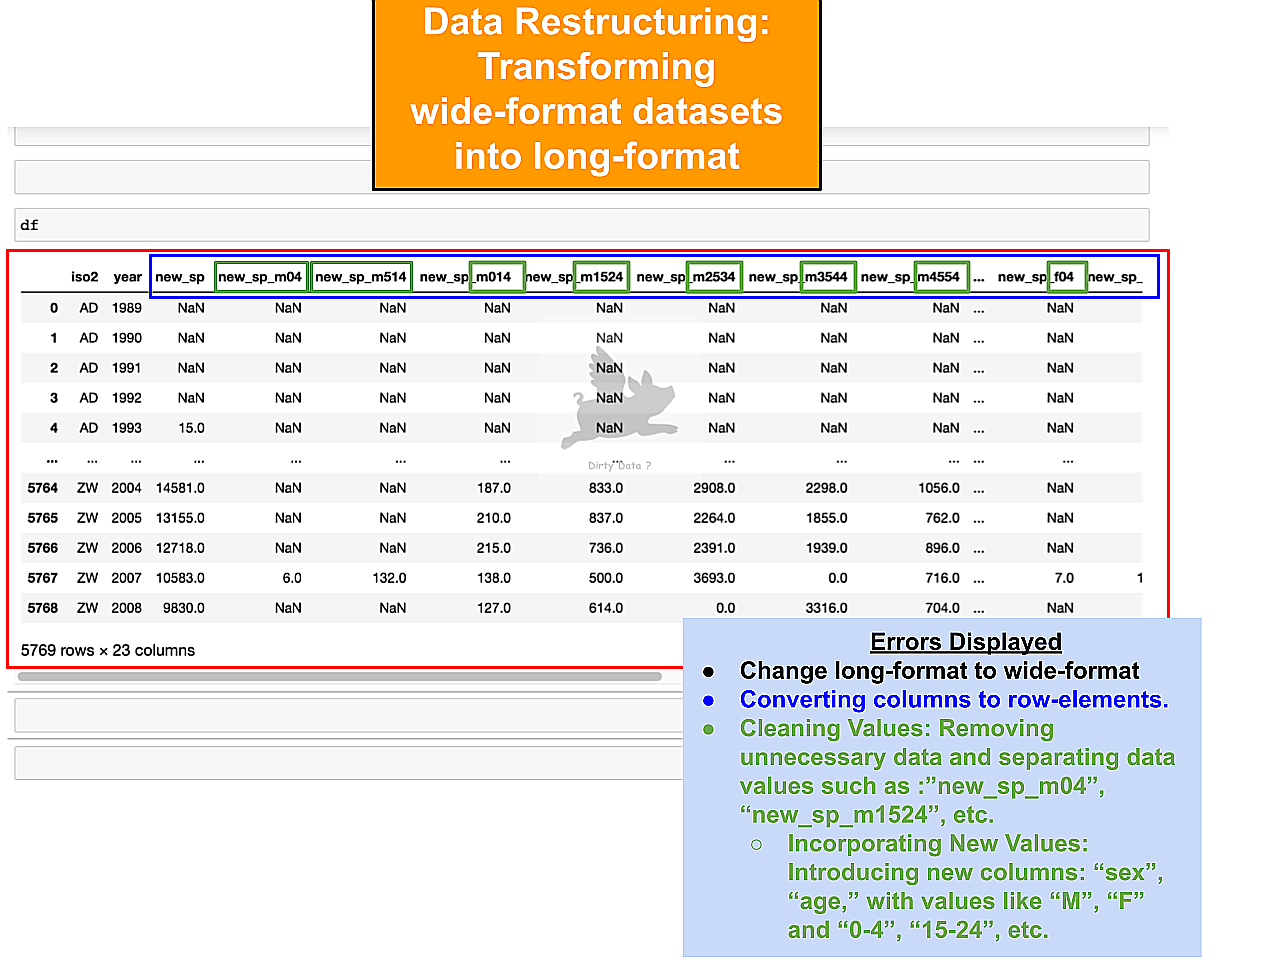
Unpivot Application
The current wide format is better represented in long format. The distinction depends on readability, visualization, and analytical goals.
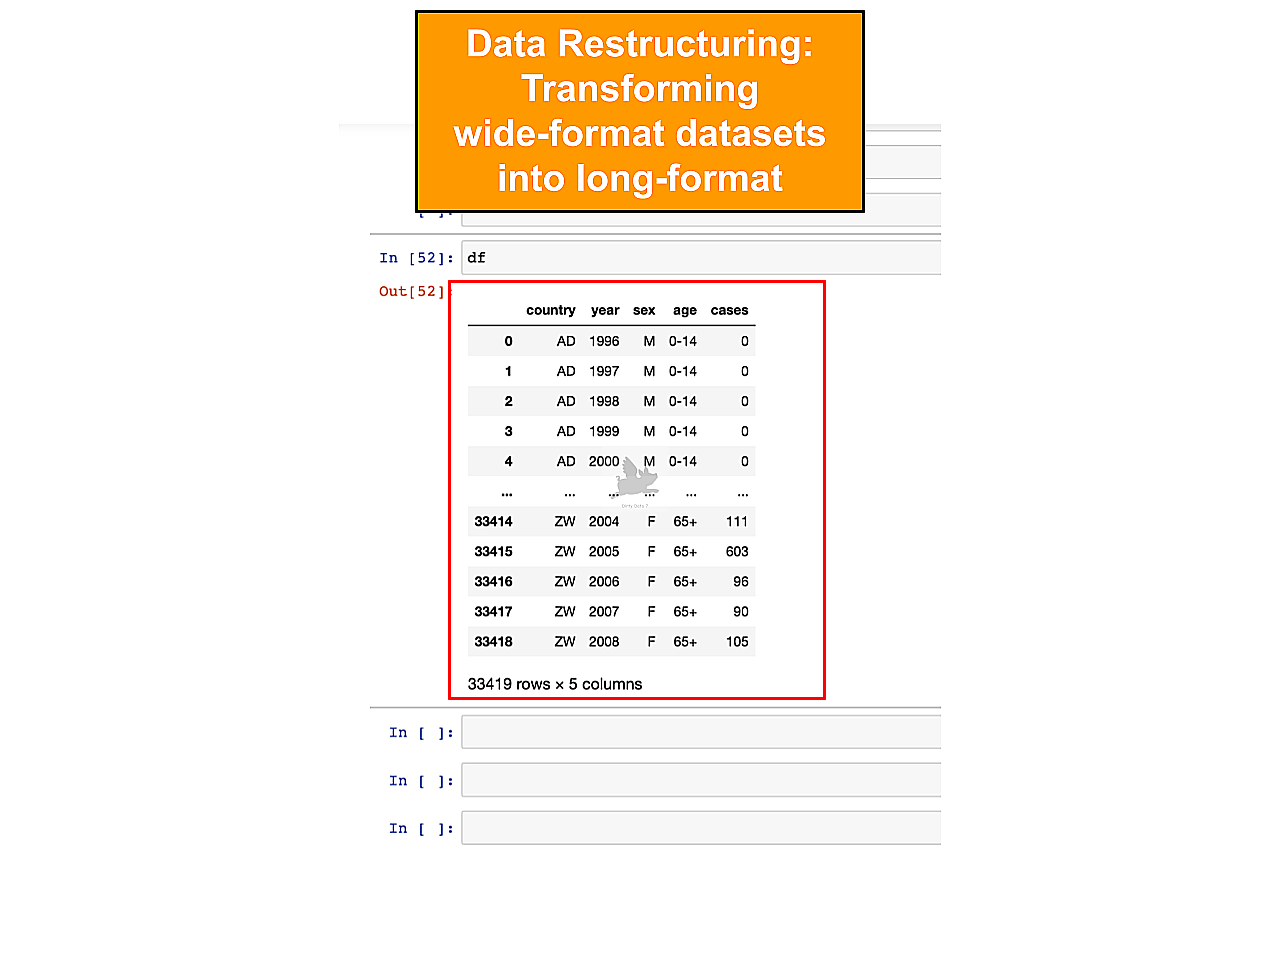
Unpivot Application
The reshaped wide-to-long format significantly improved data readability, aiding in more effective data interpretation.

Pivot Table Application
A pivot function is essential for a concise view, improving readability, and completing statistical analysis goals.
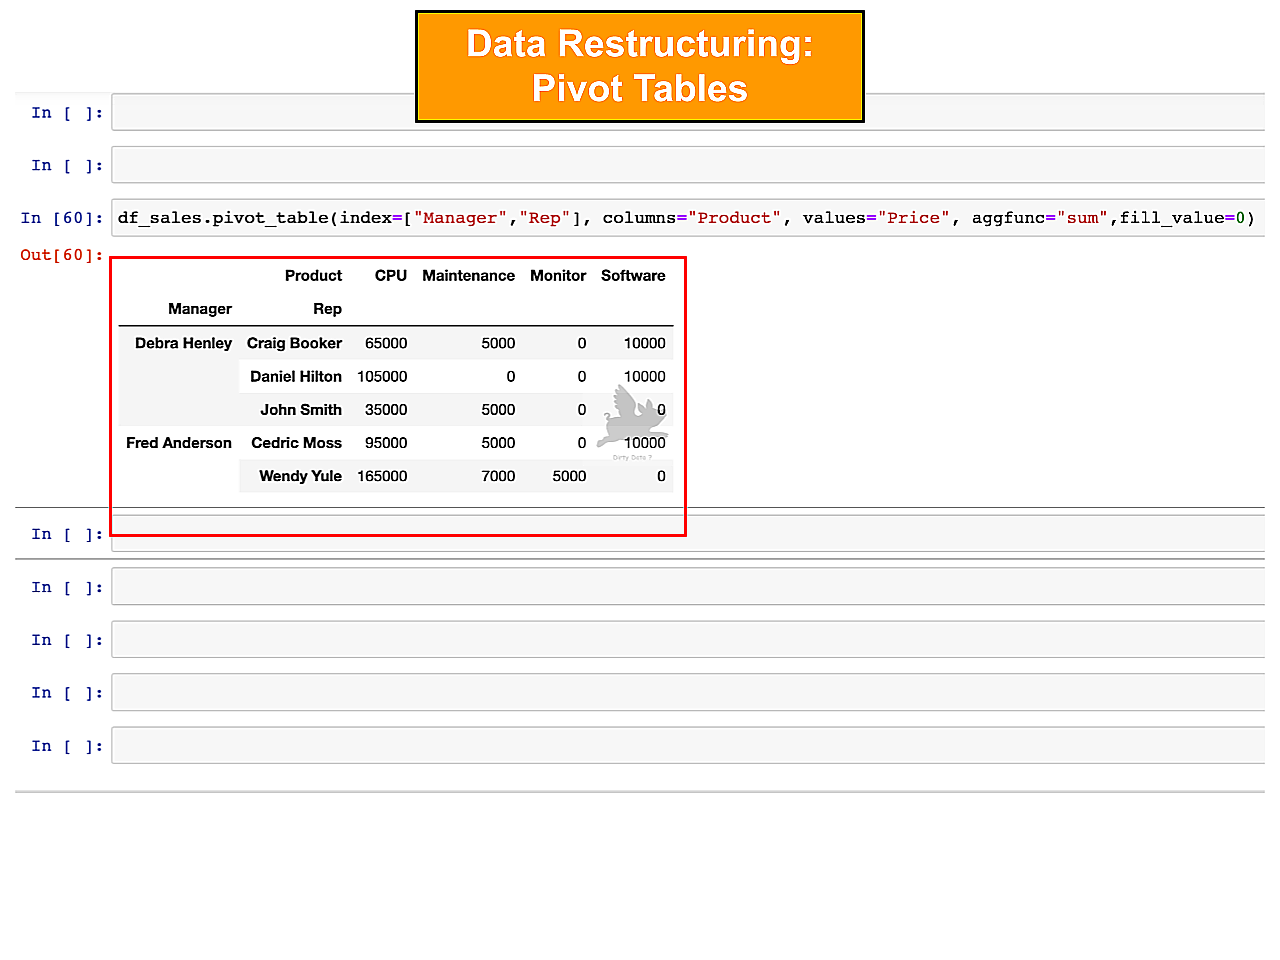
Pivot Table Application
Pivot Function enabled a compact view, greater interpretation and statistical analysis, with a focus on summation.
Applying Join Statements
Join statements are extensively used in databases to merge data from various sources. They facilitate the retrieval of relevant information by specifying how different data tables should merge based on a common attribute, such as an ID or key. Join statements allow for a holistic perspective on related data, ultimately capturing enterprise knowledge and enhancing the power of business intelligence.
Unifying Data Sources
Prior to the application of a Join statement, the isolated dataset lacks vital connections needed for comprehensive insights.
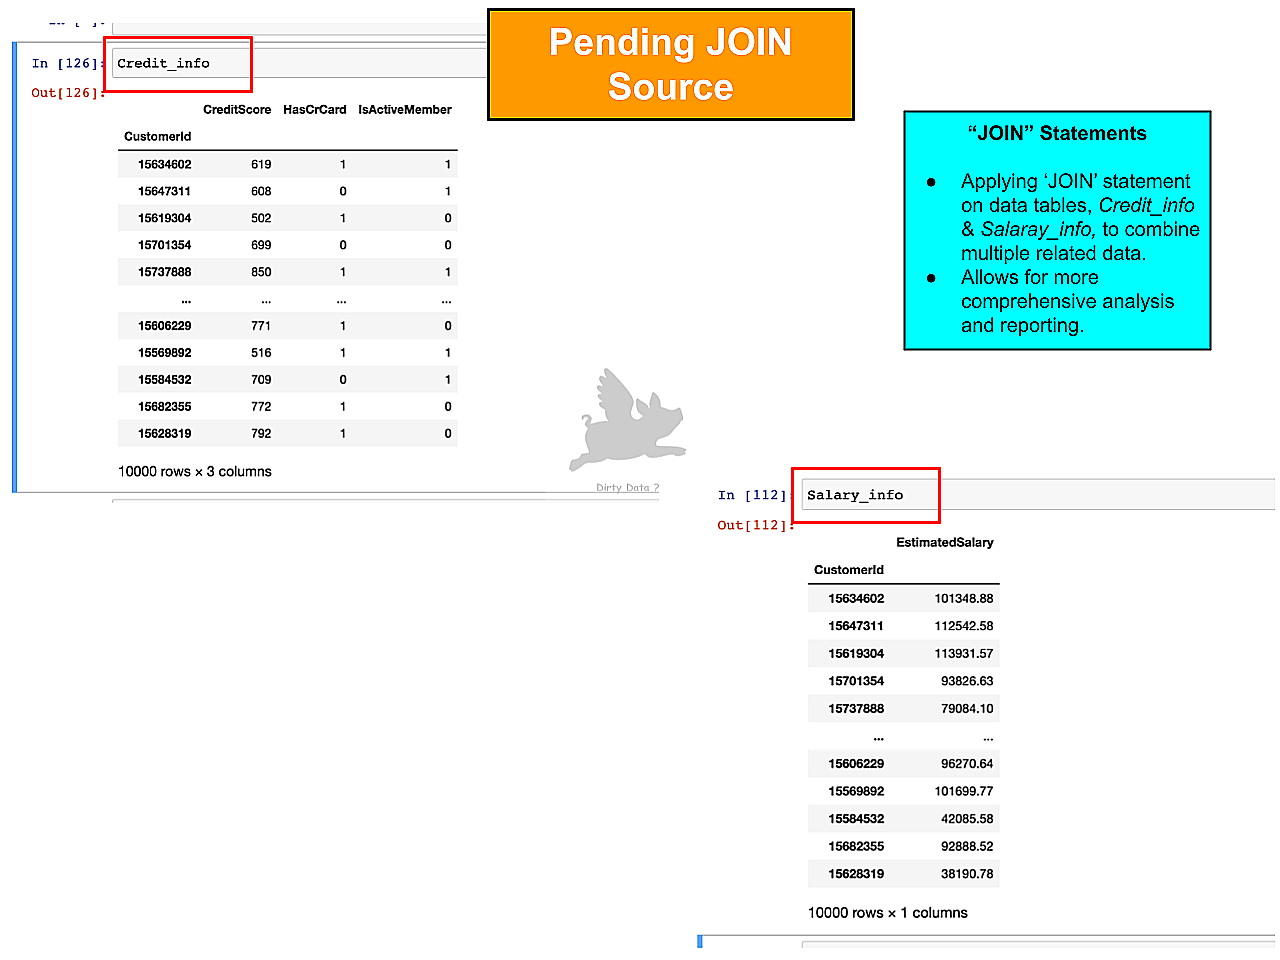
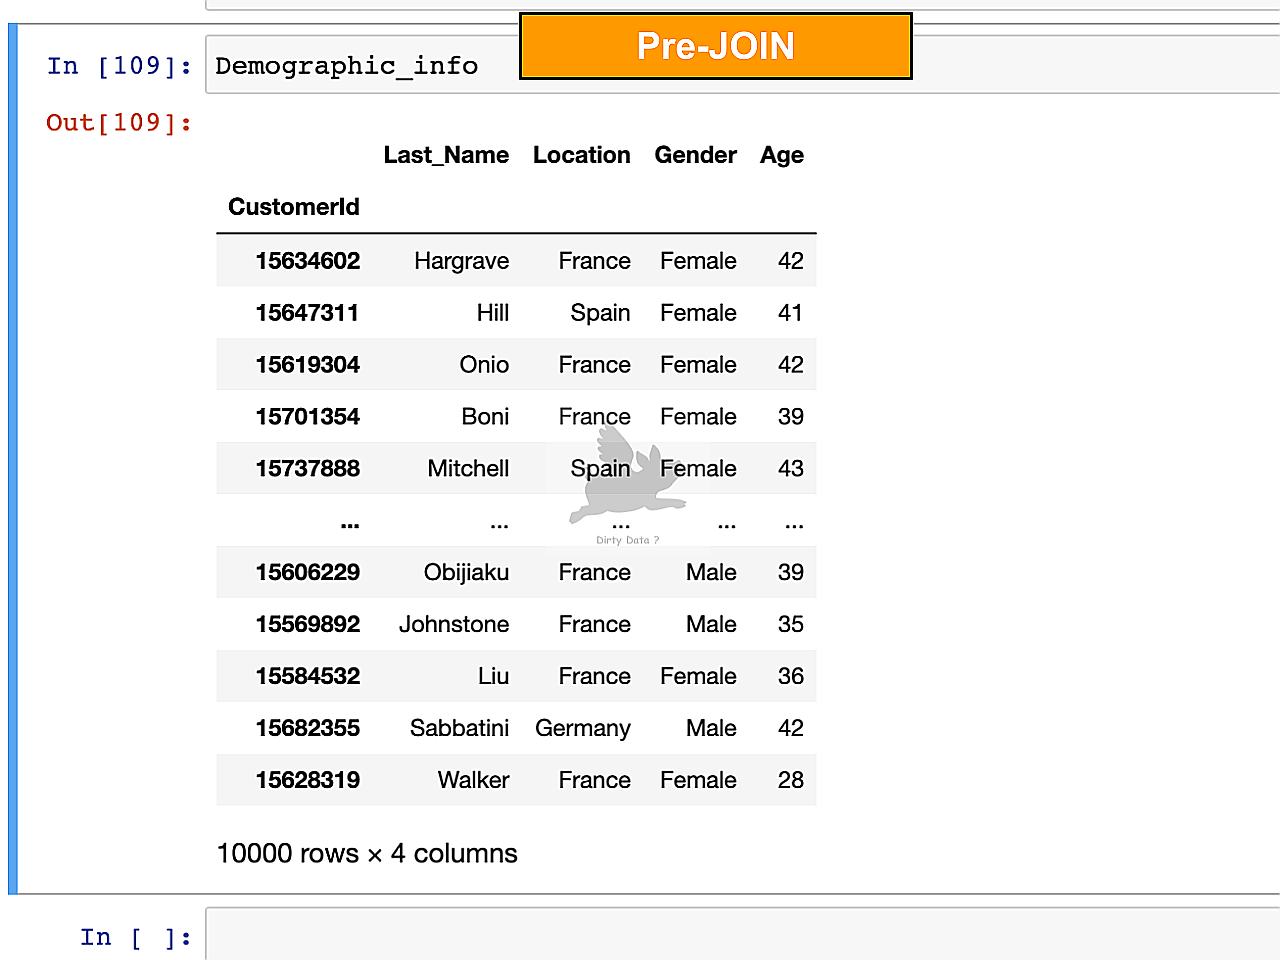
Unifying Data Sources
Related datasets are queried. A Join statement will be applied based on a common attribute, typically an ID or key.
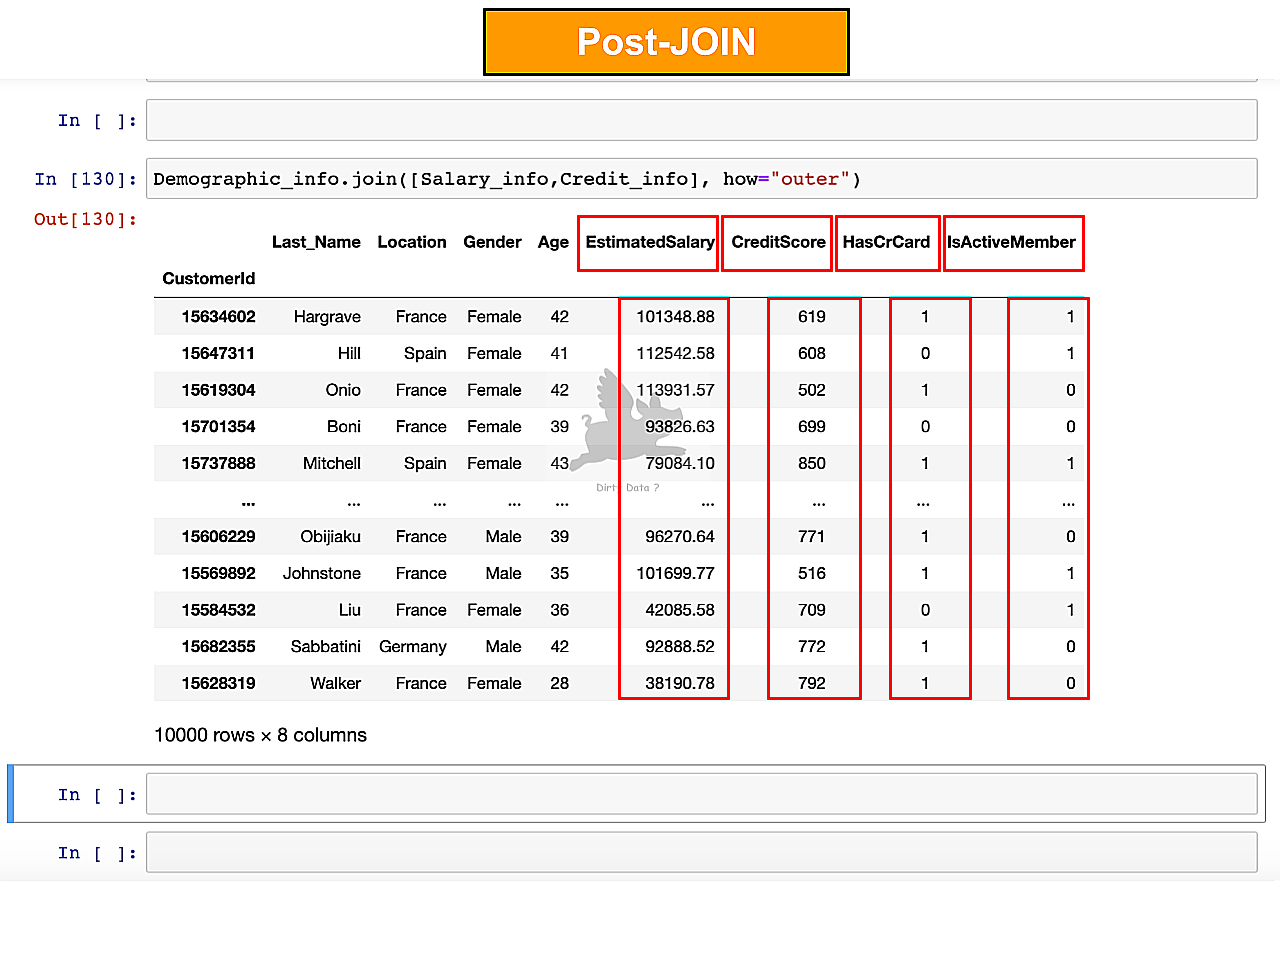
Unifying Data Sources
Successful unification was applied, enabling fine granularity of statistical analysis and fresh business insights.
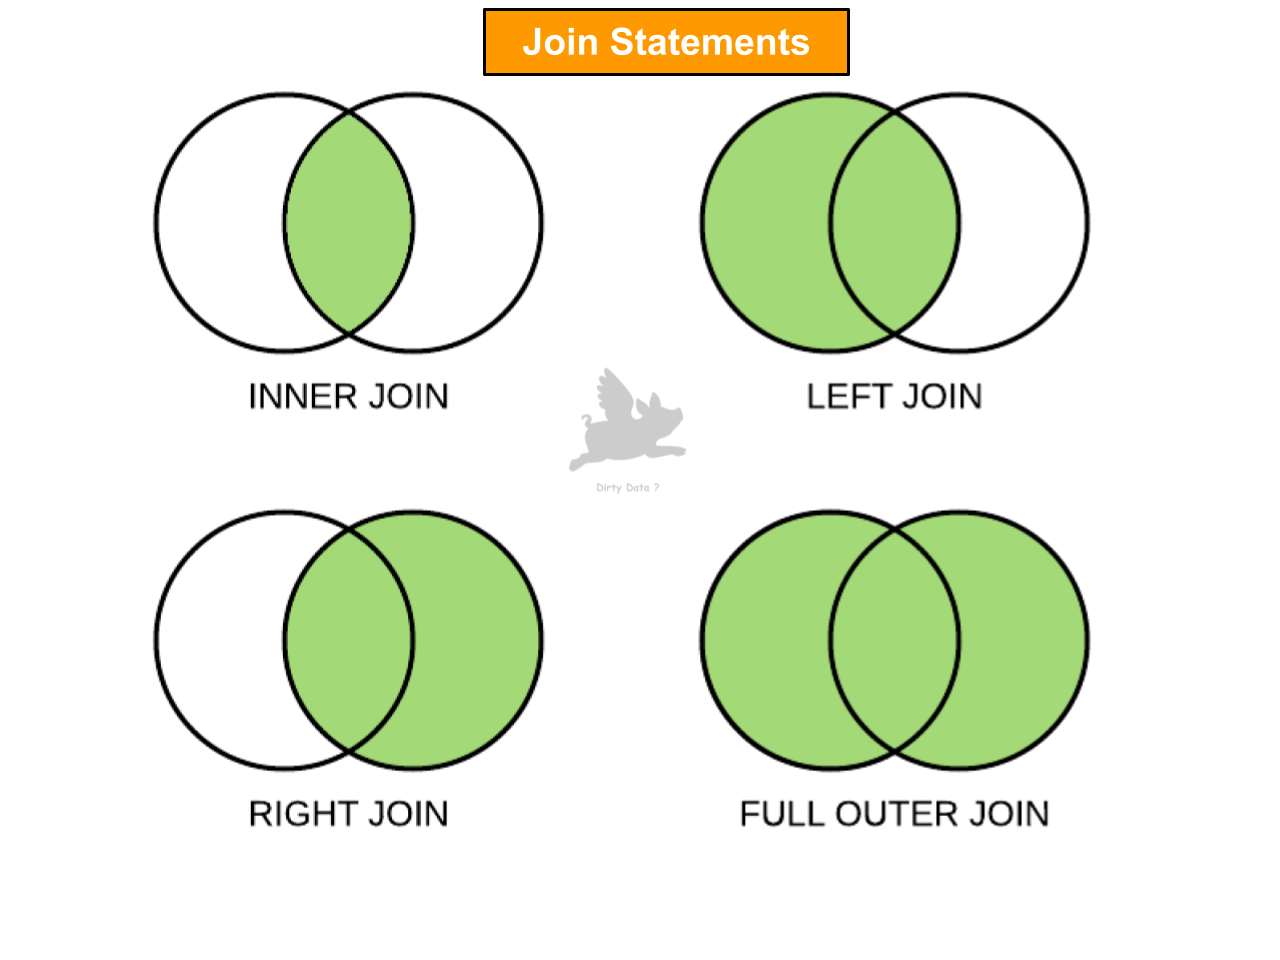
Unifying Data Sources
A visual insight displaying different join types, offering versatility and application of various data integration techniques.